Features That Can Improve Order Monitoring in MetaTrader 5
Order monitoring is often reduced to watching a profit figure change color. That is the least informative part of the job. A position can show a temporary gain while carrying the wrong volume, missing a protective stop, or sitting beside a pending order that should have been cancelled. In mt5, the most useful monitoring features keep attention on exposure and execution before emotion takes over.
Beginners tend to watch the chart first and inspect the order details only when something feels wrong. Experienced traders reverse that sequence. They confirm what the platform actually holds, then compare it with what the trade plan intended.
The Trade Tab Shows the Account’s Live Commitments
The Trade tab in the Toolbox displays open positions, pending orders, volume, entry prices, stop-loss and take-profit levels, current prices, and floating results. Its real value is reconciliation. Does the position size match the calculation? Was the pending order triggered? Is the stop attached to the correct position?
Those questions become more important when several trades are open. A long EUR/USD position and a long GBP/USD position may look like separate ideas, yet both can increase exposure to a weaker US dollar. Reading each row independently misses the account-level theme.
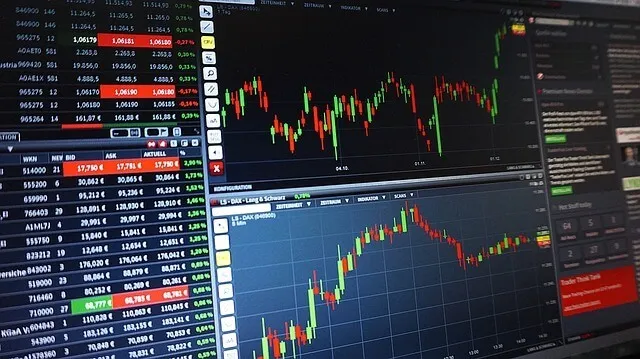
Image Source: Pixabay
The platform’s account type matters too. A netting account generally combines transactions in the same symbol into one net position, while a hedging account can retain multiple positions in that symbol. Traders need to know which structure they are viewing before assuming an entry has disappeared or been duplicated.
Chart Trade Levels Connect Orders With Market Structure
Displaying trade levels on the chart places entries, pending orders, stops, and targets beside the price action that justified them. This makes poor location difficult to ignore. A stop may appear sensible in the order list but visibly sit inside a recent consolidation when shown on the chart.
Consider GBP/USD ahead of a Bank of England decision. Price is holding beneath the previous day’s high, and a buy-stop order is positioned above resistance. The announcement triggers a brief liquidity sweep, activates the order, and sends price back into the range. The order record confirms execution, but the chart reveals why the trade immediately struggled: the entry was exposed to the first spike rather than a sustained break.
The fill was technically correct. The order placement was still vulnerable.
Chart-based monitoring also helps when adjusting a stop or target. Dragging a level can be convenient, but convenience increases the risk of casual changes. The modified price should still correspond to a structural level and the platform’s confirmation should be checked after every adjustment.
Exposure and History Reveal What P&L Hides
The Exposure tab provides a broader view of currencies and assets represented across the account. This becomes useful when different symbols carry the same underlying risk. A trader holding EUR/USD, gold, and USD/CHF may discover that the portfolio depends heavily on one dollar scenario even though the instruments look diverse.
Here is the counterintuitive insight: hiding or minimizing floating profit can sometimes improve order monitoring. Profit changes with every tick and encourages unnecessary intervention. Volume, stop placement, margin, and combined exposure usually change only when the trader acts, which makes them more useful control variables.
Account history serves a different purpose. It confirms executed prices, order changes, commissions, swaps, and closed results. After volatility, comparing the requested entry with the recorded fill can reveal slippage that the candle alone cannot explain.
Alerts and Depth of Market Add Context
Price alerts reduce the need to stare continuously at an active chart. An alert near a pending order, invalidation point, or major support level can bring attention back when a decision is actually required. Alerts should mark conditions, not every minor fluctuation.
Depth of Market, where supplied for the instrument and account, shows available bid and ask levels visible through the broker’s feed. It can help illustrate thin liquidity or concentrated interest, although it is not a complete picture of the global market. Treating it as certainty gives the display more authority than it deserves.
For a practical mt5 routine, inspect the Trade tab immediately after every entry, verify volume and protective levels on the chart, then check total exposure before opening another position. Set one alert near the next decision point. After the trade closes, compare the intended and recorded execution prices before judging the setup itself.